


Technical Trivia by Dr. FB
Observing filter characteristics with a white noise generator
Dr. FB
The electronics project of a white noise generator was featured in a "Short Break" article in the December 2022 issue of the monthly FB News. A local ham asked me, "Why build a device that generates noise when it is better to have no noise? I prepared a simple experiment to answer the question.
Definition of the noise
There is a noise called “white noise,” which may be an unfamiliar term to many people. This is a continuous electrical signal that is almost constant in level over a wide frequency range. Although it is an electrical signal, no information is superimposed on it, so we call it noise.
Although I have mentioned a wide frequency range here, there is also noise with a narrow frequency range, which will be discussed later.
We generally think of noise as all signals other than the intended signal, including those in the electrical field with which we deal. For example, those who communicate in Morse code know that "Dah Dit Dah Dit" is a desired signal. It is a pleasant sound for those who love CW. Others, however, may think of it as a "beep, beep, beep!” Others may treat Morse code as noise. I feel that the definition of "noise" varies, depending on the field in which the signal is handled.
When a car drives outside while communicating, the receiver may receive engine noise and a buzzing sound may be heard from the receiver speaker. The "buzzing" sound is obviously a signal that is not intended, so it is noise to us. In order to eliminate this noise, radios are equipped with a Noise Blanker function. When the car moves away, the buzzing sound disappears, and the speaker emits a “buzz" sound. This "buzzing" sound is heard even when the antenna connected to the receiver is disconnected, indicating that there is noise generated inside the receiver in addition to the extraneous noise received by the antenna.
Even an ordinary AM/FM radio, when the tuning is off, a "buzzing" sound that can be heard through the earphone or speaker. Figure 1 shows the sound taken from the speaker jack and observed by WaveSpectra*.
WaveSpectra* is an application software that creates an audio spectrum analyzer on a PC.
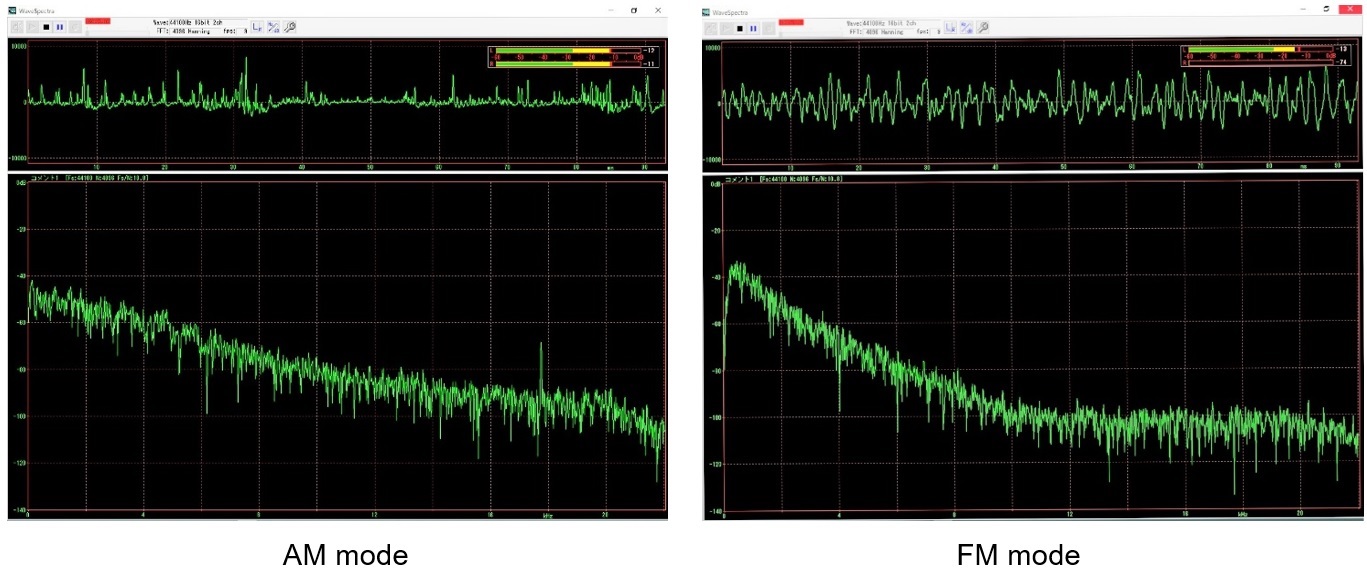
Figure 1. Spectrum of radio noise sound
The span of the WaveSpectra screen shown in Figure 1 is 20 kHz. The horizontal axis is a linear scale from 0 to 20 kHz, and the vertical axis is a logarithmic scale in dB. Even the buzzing noise can be observed with the audio spectrum scope to show the difference between the AM and FM modes. The screen image shows that the radio has a good low frequency range, perhaps because it is intended to be listened to with earphones.
For reference, Figure 2 shows the output from the IC-705 speaker jack observed by WaveSpectra while the antenna terminal of the IC-705 was shorted to prevent external signals and noise from entering.
In this case, only a "buzzing" sound is heard from the speaker, but the spectrums of the noise are clearly different, depending on the mode. These spectrum displays are not uniform in level over the wide frequency range described earlier. This is not what we call “White noise.”
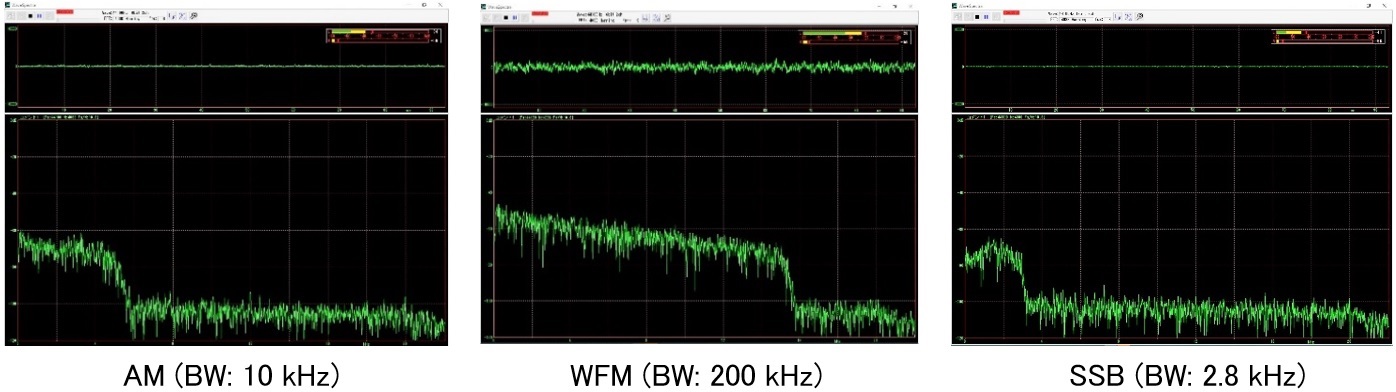
Figure 2. Spectrum of noise in each mode observed from an IC-705
This is “White noise.”
All of the noises shown in Figure 2 are heard from the speaker as a "buzzing" sound, but they actually have a frequency response, depending on the mode. Figure 3 shows the spectrum of the noise generated by the white noise generator introduced in the "Short Break" article of the December 2022 issue of the monthly FB News. You can see that the output is not the output cut by the filter inside the receiver, as shown in Figure 2, but a signal (noise) of almost the same level over the entire frequency band of 0 to 20 kHz that can be observed by WaveSpectra. This signal is what we call “White noise.”
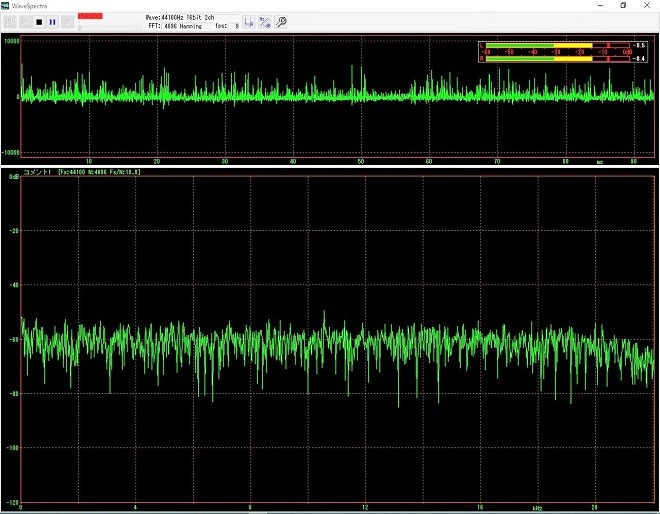
Figure 3. Spectrum of noise generated by the white noise generator (Span: 20 kHz)
Since WaveSpectra is a spectrum scope for the audio band, it is not possible to check the spectrum above 20 kHz. I connected the output of the noise generator to the antenna terminal of the IC-705 to see if there was a signal above 20 kHz. I confirmed that the IC-705 receives noises up to about 21 MHz with S-meter readings. As the frequency increases, the output level of the white noise generator decreases, but I confirmed that noise is still being output over a wide range.
Observing the frequency response of an audio amplifier using a white noise generator
Until a decade ago, the frequency response of an audio amplifier was observed by connecting it as shown in Figure 4. Connect an AG (audio generator; low-frequency oscillator) and a milli-voltmeter to the input terminals of an audio amplifier, and while keeping the input signal level constant, read the output level for each input frequency with the milli-voltmeter. The readings were plotted on graph paper and the characteristics were observed. In the corporate world, automated measuring equipment performs this series of tasks, but we amateurs still rely on this method.
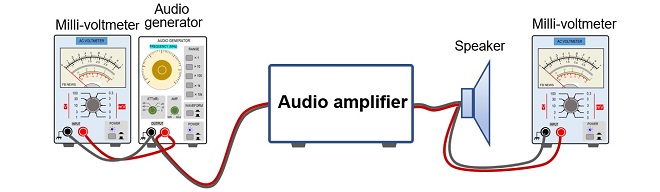
Figure 4. Simplified method of measuring the frequency response of audio amplifiers
If the input signal maintains a constant level with respect to the frequency, and if the frequency of the input signal is continuous over a wide range rather than pinpoint, then the operation of the input-side measuring instrument in Figure 4 becomes unnecessary. A white noise generator is useful when a signal of approximately the same level over this wide frequency range is required.

Figure 5. Observing the frequency response of an audio amplifier using a white noise generator
Observing the frequency response of an audio amplifier with the LM386
Observe the frequency response of the audio amplifier featured in the "Short Break" article of the February 2021 issue of the monthly FB News with this white noise generator. This audio amplifier uses the LM386, a low-voltage audio power amplifier IC chip. The sound quality is not as good as expensive Hi-Fi amplifiers, but it still sounds quite good when connected to reasonable loudspeakers. A white noise generator is connected to the input of the audio amplifier and its output to the PC, respectively, and the output signal is observed by WaveSpectra. Figure 6 shows the frequency response of the audio amplifier.
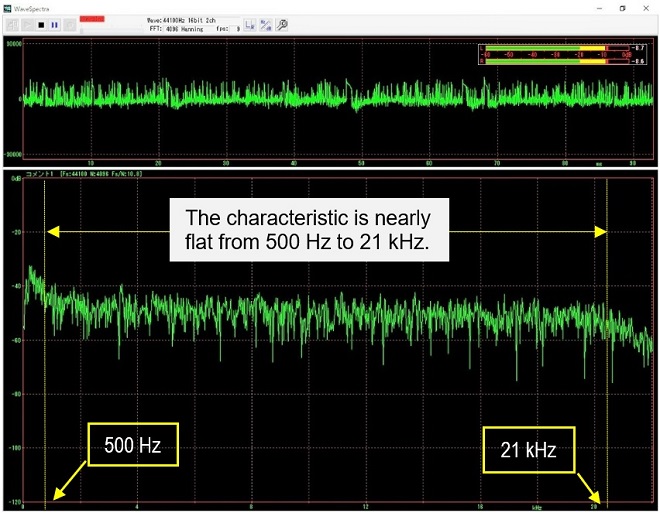
Figure 6. Frequency response of audio amplifier using LM386
As a reference, white noise is input to an audio amplifier through a HPF composed of a capacitor and resistor with a cutoff frequency of 10 kHz, and its output is shown in Figure 7 as viewed with WaveSpectra. Clearly, the output level increases as the frequency increases from around 1 kHz, and it can be seen that the higher frequencies are emitted while the lower frequencies are cut off.
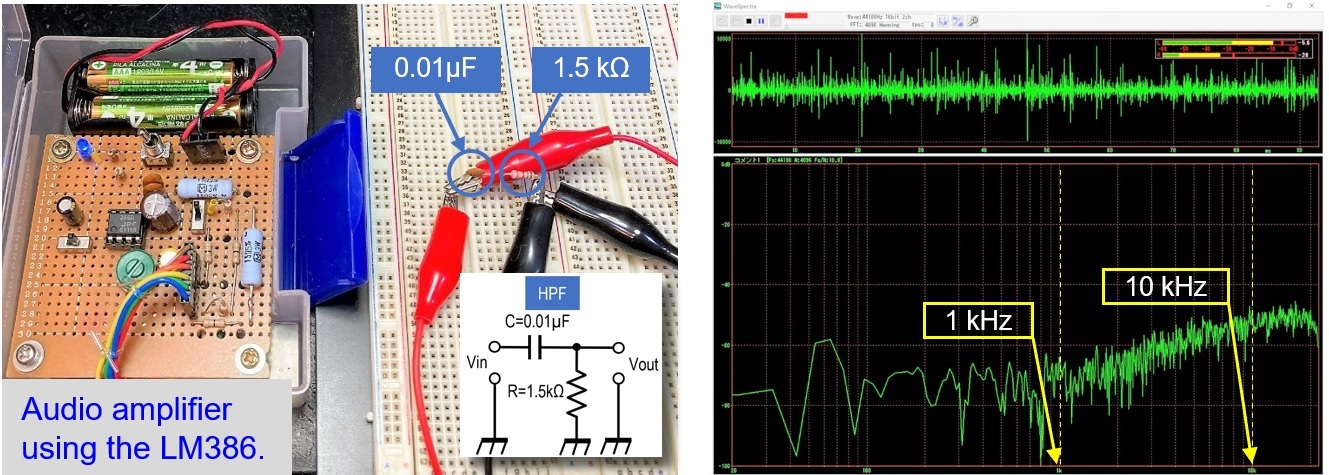
Figure 7. Frequency response of white noise input to the audiophile amplifier through the HPF
Measure IF filter characteristics
Since the output of this white noise generator seems to extend to around 21 MHz, the next step is to observe the characteristics of the 455 kHz mechanical filter and 10.75 MHz crystal filter used in the IF stage of a receiver.
The observation method is to connect the output of the white noise generator to the input terminal of the filter and observe the signal appearing at the output terminal of the filter with tinySA, which can observe up to the RF range. Figure 8 shows the characteristics of a 455 kHz mechanical filter on the left and a 10.75 MHz crystal filter on the right.
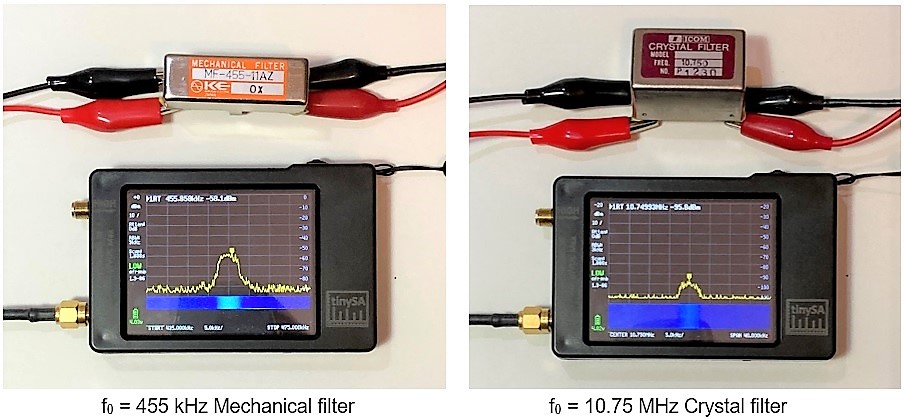
Figure 8. Observe IF filter characteristics
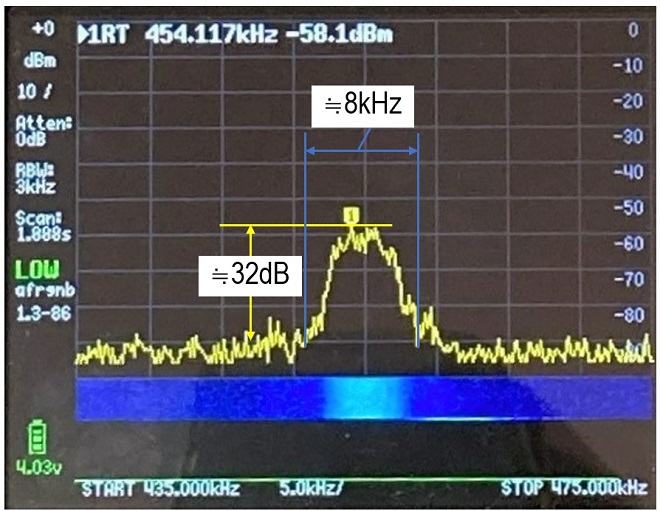
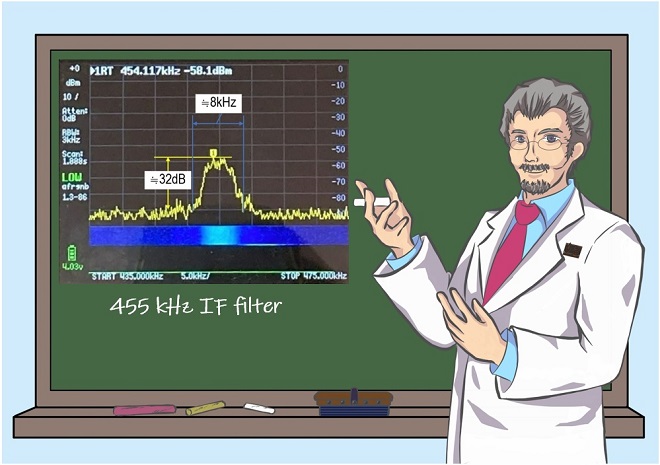
Figure 9. Reading the characteristics of a 455 kHz mechanical filter on the scale
Figure 9 is a close-up of the left characteristic diagram in Figure 8. The screen in this figure shows 435.000 kHz on the far left, 475.000 kHz on the far right, and 455.000 kHz in the center.
The horizontal axis is 5 kHz at a glance and the vertical axis is 10 dB at a scale of 1. Reading the filter characteristics from the screen, we see that the bandwidth drop at approximately 30 dB is 8 kHz.
This is a simplified method, so you cannot read the shape factor on the screen, which is the ratio of the bandwidth drop at 3 dB from the peak to the bandwidth drop at 60 dB, but you can get a feel for the filter's characteristics. If the noise output range of the white noise generator extends from AF to RF, you can even see the characteristics of the filter used in the IF stage from the audio amplifier as shown above. It can also be used for bandwidth adjustment of receivers, and so on, and one unit is very useful.
Reference information
efu's home page on WaveSpectra is stored in an archive folder shown below.
http://web.archive.org/web/20171105052121/http://efu.jp.net/
FBDX
Technical Trivia by Dr. FB backnumber
- Generating “Sawtooth Waves” using a D/A conversion circuit and a counter IC
- Examining a D/A converter using a Resistor Ladder
- Electronic firefly and its circuit description
- Controlling the rotation speed of a DC motor
- Description of up-down counter using 74HC192 and 74HC4511 ICs
- Considerations when making a dual voltage power supply for operational amplifiers
- Observing filter characteristics with a white noise generator
- Is noise actually reduced in twisted pair cables?
- Experiments on divider circuits using a 74HC74
- Consideration of using a photocoupler as a voltage-variable resistor
- Distorted waveform spectrum as observed on a tinySA
- Trial making of a QFH antenna
- About the inductance of coils
- Operation of analog switches
- Small digital voltmeter, 2-wire type / 3-wire type. What is the difference?
- Constant current circuit using an Op-Amp
- Coaxial cable loss to UHF and SHF
- 2.4 GHz Wireless LAN Antenna
- Let’s use MOSFETS
- 25th Comparator
- The principle of PLL
- Examination of the MLA performance
- About the Fresnel zone of the SHF band
- Level difference under open and load ends of an SSG
- Is “Made in Japan” alive? (UHF adapter again)
- Possibility experiment of passive repeater with the Back-to-Back antenna
- Why you should make SWR measurements just below the antenna!
- How reliable is the L-type BNC?
- Is the Bird 43 accurate enough?
- Does a wire dipole antenna need a balun?
- Why we don’t use a silicon diode in a crystal radio?
- How to light the 7-segment LED
- Measurement of Antenna Performance on Handheld Transceivers (Part 3)
- Measurement of Antenna SWR on Handheld transceivers (Part 2)
- Measurement of Antenna SWR on Handheld transceivers(Part 1)
- An SWR meter
- V/UHF 3-Band Antenna Dismantling Note